


Medical progress happens every day with new medicines, devices, and diagnostic tools steadily emerging. How can patients fully benefit from these? How can doctors and pharmacists stay up to date with the endless stream of pharmaceutical research? How can you make medical decisions when comparisons between all medicines are rarely available?
Well, a network meta-analysis (NMA) might be the answer. In contrast to a traditional meta-analysis, which is limited to only two drugs, an NMA can compare three or more drugs, including those not yet compared in a clinical trial. And although an NMA is less certain than a standard meta-analysis, it is currently the best source of evidence available with the ever-increasing number of treatments and the lack of direct comparisons between them.
It might sound complicated, but you are only eight steps away from knowing how it’s done and how to interpret the results.
With that said, let’s get started!
In a previous blog, my colleague Finn explained how statistics work while answering whether elephants get longer trunks by eating bananas. To keep the story going, we will do an NMA to investigate which fruit is the most effective for trunk lengthening.
Step 1 – Define the research question
Which fruit will lengthen the trunk the most?
Let’s assume that we know from previous studies that eating fruits like bananas, apples, and cherries will lengthen the elephants’ trunk, but we want to perform an analysis that can summarize all the available data in a single report. Since baby elephants are still in the growing process, it’s impossible to estimate the impact of eating a particular fruit on their trunk’s length. For this reason, we will only focus on adult elephants. We also want to minimize the risk of bias; therefore, we will include only studies with a random assignment to either fruit group.
With this in mind, we can use the PICOS (Population, Intervention, Comparator, Outcome, Study design) framework to define the research question further. Our PICOS will look like this:
- Population: adult elephants
- Intervention: bananas, cherries, and apples
- Comparator: bananas, cherries, and apples
- Outcome: trunk length
- Study design: random assignment
Step 2 – Data collection
Where can we find the answer?
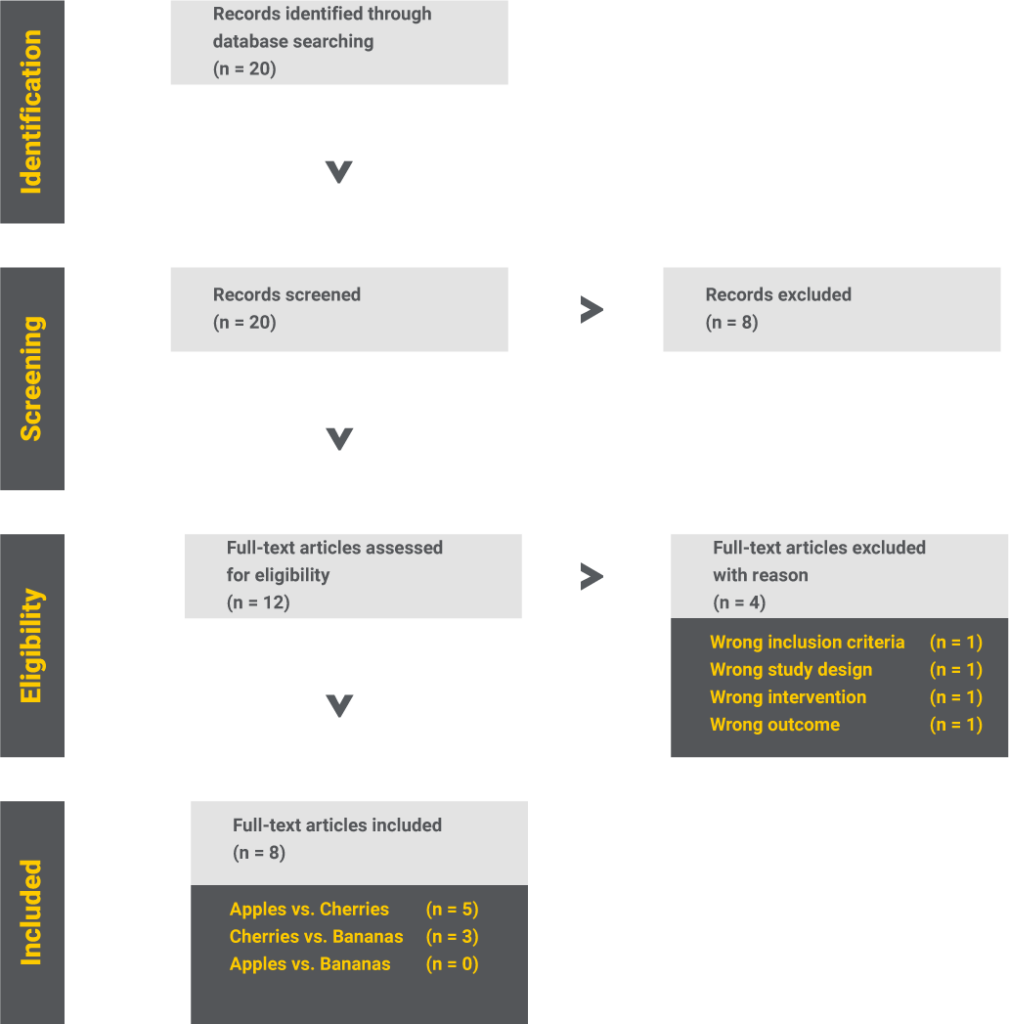
We start by identifying all the studies related to our subject and include only those that fit the previously defined PICOS.
So, we found eight studies investigating the relationship between eating certain fruits and trunk length. Out of these, five compare apples to cherries, three cherries to bananas, but none compare apples to bananas.
Step 3 – Network diagram
What do we know?
An excellent way to summarize the data collection results is by using a network diagram. This graphic depicts interventions as nodes (the dots) and existing trials as edges (the lines). Suppose we draw the nodes and the edges proportional to the number of participants and trials. Then the network diagram will tell us how much information is available and which comparison has a higher impact in a matter of seconds.
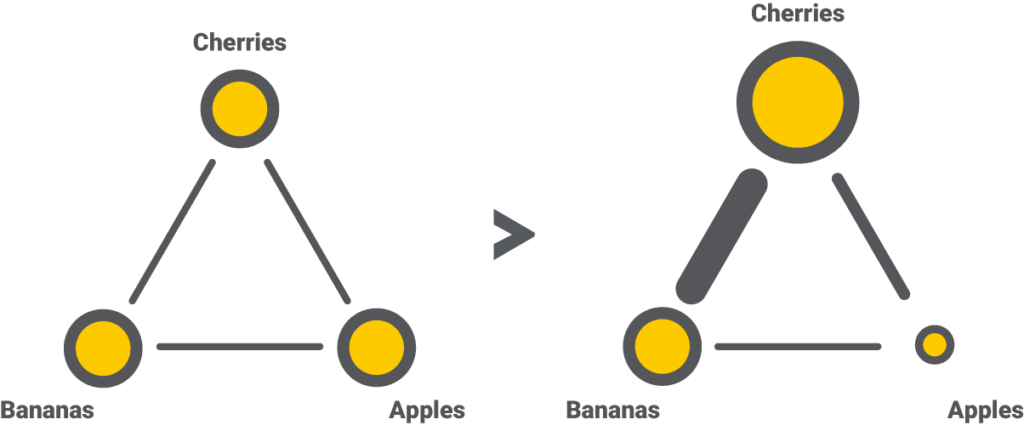
For each outcome, the NMA will generate a separate network diagram. Since we are only interested in the trunk length in our use case, we will need just one.
Step 4 – Estimating the indirect evidence
What can we say about apples vs. bananas?
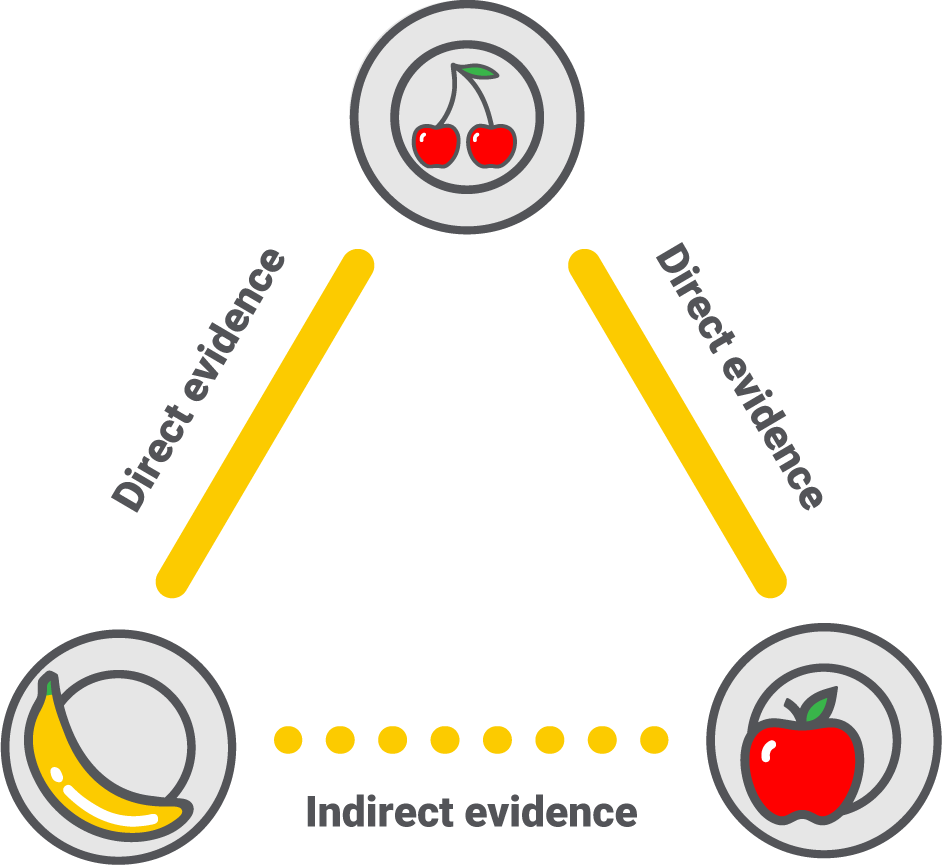
An NMA can compare and rank all interventions in a network diagram by combining direct and indirect evidence. Direct evidence comes from previous trials comparing the interventions, while indirect evidence is calculated based on direct evidence and common comparators.
We have five trials comparing apples vs. cherries and three comparing cherries vs. bananas. The NMA will first summarise the evidence as two single results and then use those results to calculate apples vs. bananas via the common comparator – cherries. For this to be possible, the trials apples vs. cherries and cherries vs. bananas must be similar in all aspects, like population, outcome measured, and study design. We call this the assumption of transitivity. The only acceptable difference should then be the compared intervention.
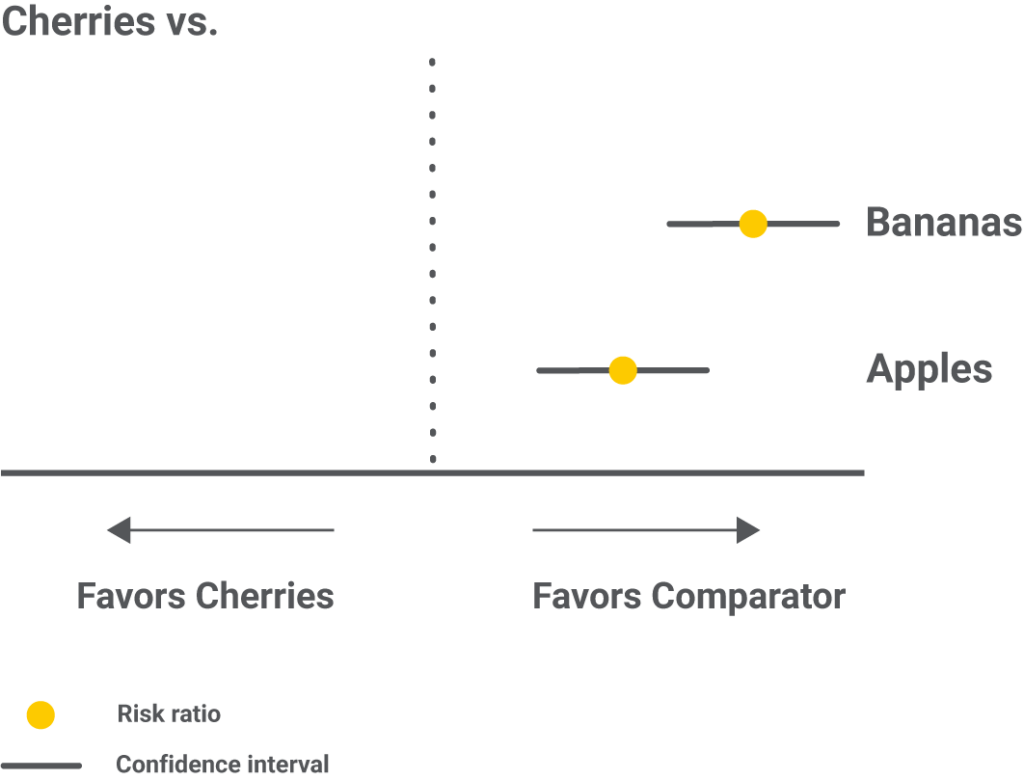
Step 5 – Results as a league table and forest plots
How do apples, cherries, and bananas compare to each other?
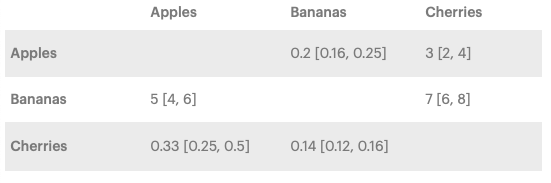
The results of an NMA are presented as pairs of interventions in an easy-to-read matrix called the league table. Each number in the matrix is a risk ratio, and it is calculated by dividing the probability of the trunk to lengthen eating the row-defining fruit by the probability of the trunk to lengthen eating the column-defining fruit. A value greater than 1 favors the row-defining fruit, while a value lower than 1 favors the column-defining fruit.
The risk ratio also has a 95% confidence interval that says where the result will most likely lie in 95% of the cases; the narrower, the more confident we can be in the result.
In the bananas vs. apples example, the risk ratio is 5, meaning that eating bananas has a five times higher chance to cause trunk growth than eating apples. The 95% confidence interval of [4,6] is narrow, which is also good.
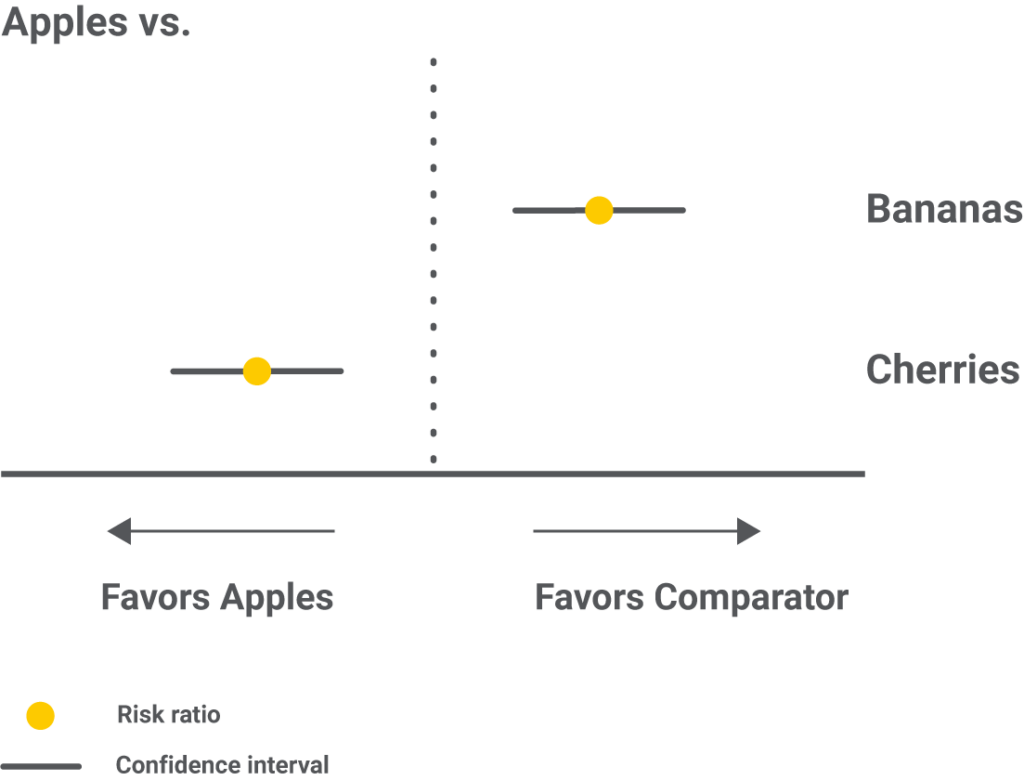
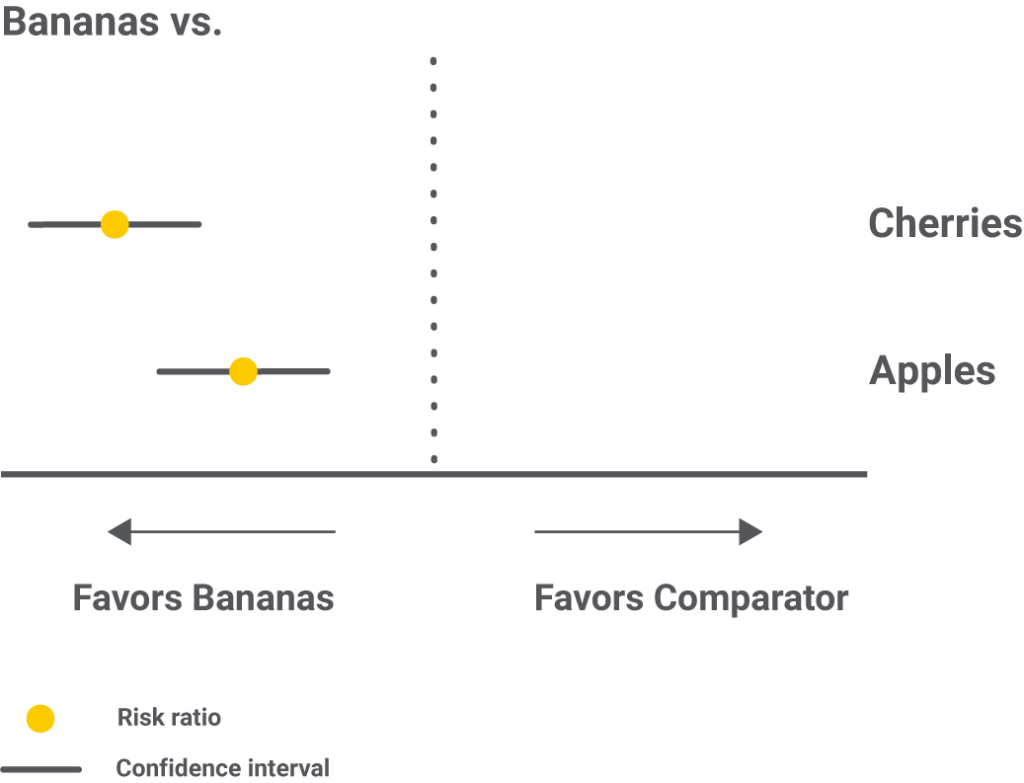
Forest plots with one intervention compared to all the others are an alternative to showcase the same results.
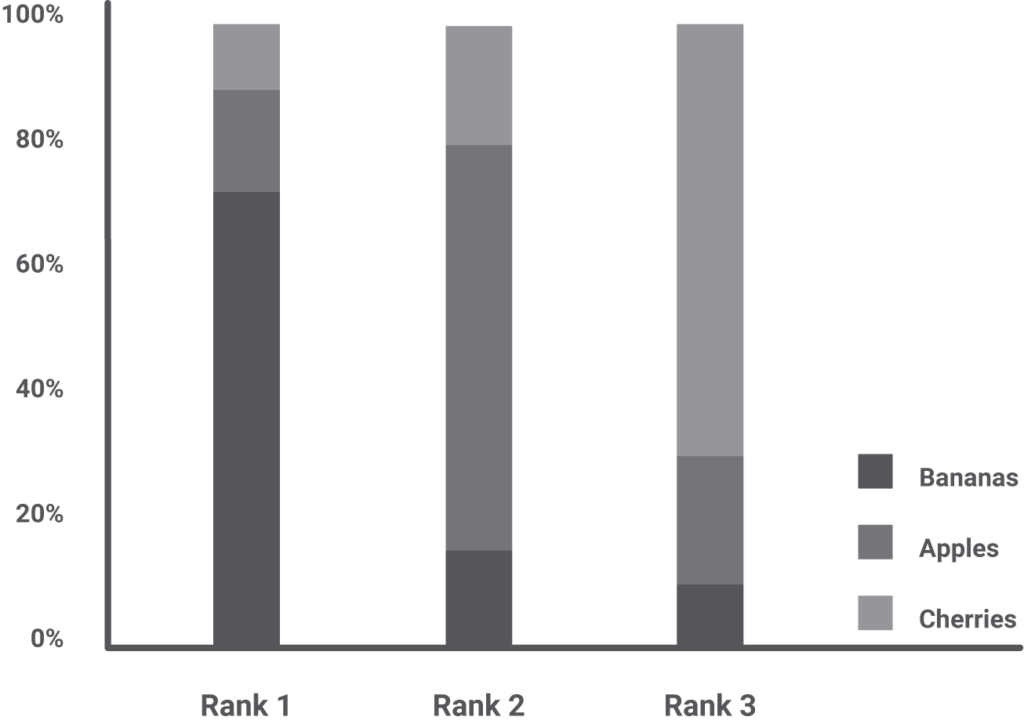
Step 6 – Results as ranking the interventions
Let’s see the podium!
An NMA can rank the interventions and display the result in multiple ways, such as a bar chart, with every rank a bar and each intervention a segment of that bar. The size of a segment is proportional to the probability of an intervention to take that rank.
In our example, we see that bananas have the highest probability of scoring first, but they can also rank second or even third for a few elephants. Although visually appealing, one should never interpret the ranking as a stand-alone result but complementary to the risk ratio, confidence interval, and actual effect. Bottom line, if the best ranked is two times better than the worst-ranked, but this translates into a trunk lengthening of 1 mm instead of 0.5 mm, does the ranking even matter?
Step 7 – Quality of evidence
We have the results, but can we trust them?
It is just as important as having a result knowing the quality of the studies behind it. Only when the quality is good can we use the result to support the decision-making process.
By following the current standard – the CINeMA (Confidence In Network Meta-Analysis) approach, we assess six domains: risk of bias, indirectness, reporting bias, imprecision, heterogeneity, and incoherence. The three possible ranks for either of them are: “no concerns,” “some concerns,” or “major concerns.”
The risk of bias is evaluated by answering five groups of questions, as mentioned in the Cochrane Risk of Bias tool 2. Each study will then receive a rating and a color-coding: “no concerns – low risk of bias” – green, “some concerns”- yellow, or “major concerns – high risk of bias” – red. A contribution matrix can graphically summarize this information for every pair of interventions. Next to each comparison, there will be a colored horizontal bar, where segments are the studies, and the size of the segments is proportional to their contribution.

Indirectness evaluates the similarity between the included studies and how well their PICOS compares to the one of the NMA. If indirectness has major concerns, the transitivity assumption didn’t hold, and the information we’ve gathered won’t answer our question. It is also visually summarized as a bar chart.

Imprecision looks at the confidence interval and the area of clinical equivalence. The latter is determined based on medical expertise, and it sets the values between which we consider two interventions as equal. For example, if we decide that we shall only accept one fruit as better if it’s at least 25% more effective than another, this translates into an area of equivalence between 0.8 and 1.25. Any value that falls inside these limits would mean there is no difference in the fruit’s effect.
In the graphic below, all possible scenarios of imprecision are showcased. Although the risk ratio favors bananas in every one of them, the difference lies in how the confidence interval and the area of clinical equivalence overlap.
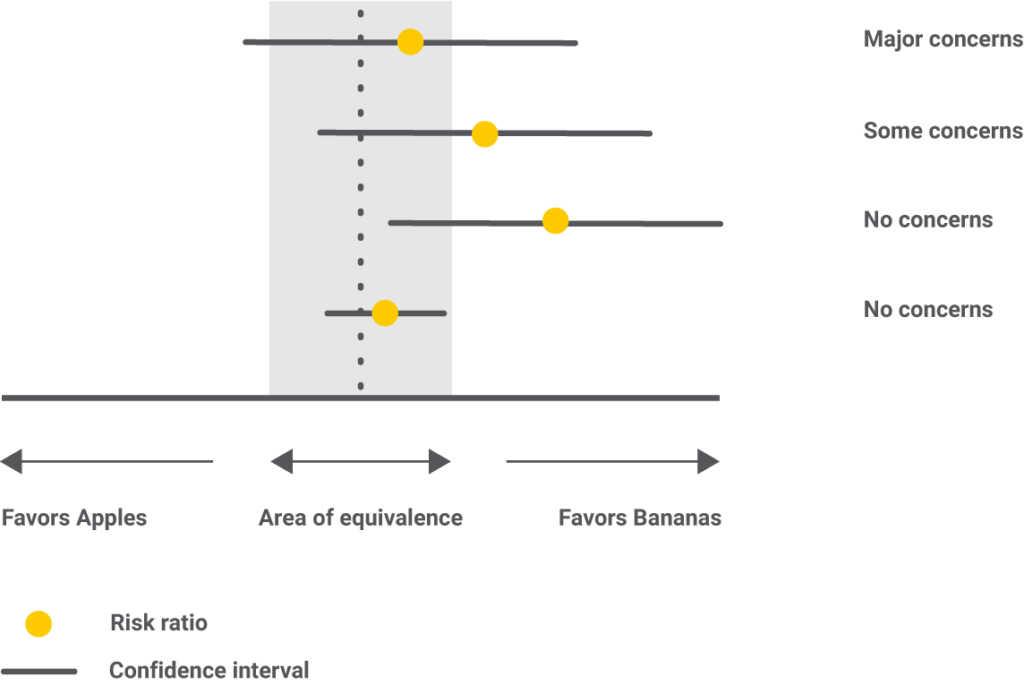
In the first example, imprecision has “major concerns” because the result fails to give a decisive winner. The confidence interval stretches on both sides of the area of clinical equivalence, meaning that for some elephants, apples, while for others, bananas will lengthen the trunk more.
In the second example, the confidence interval slightly goes on the favors apples side, but within the area of clinical equivalence. For this reason, imprecision only has “some concerns.”
In the third example, the confidence interval goes as low as saying there are no differences between bananas and apples, but still, within the favors bananas side; therefore, “no concerns” are recorded.
In the fourth example, there is no disagreement between the confidence interval and the area of clinical equivalence, so “no concerns” are noted.
Heterogeneity requires the calculation of the prediction interval, which tells where the result of a hypothetical future study, similar to the included ones, will most likely lie. We will then compare the conclusions drawn based on the confidence interval vs. the prediction interval, and if there are differences, then a higher level of heterogeneity is noted. All possible situations are presented below.
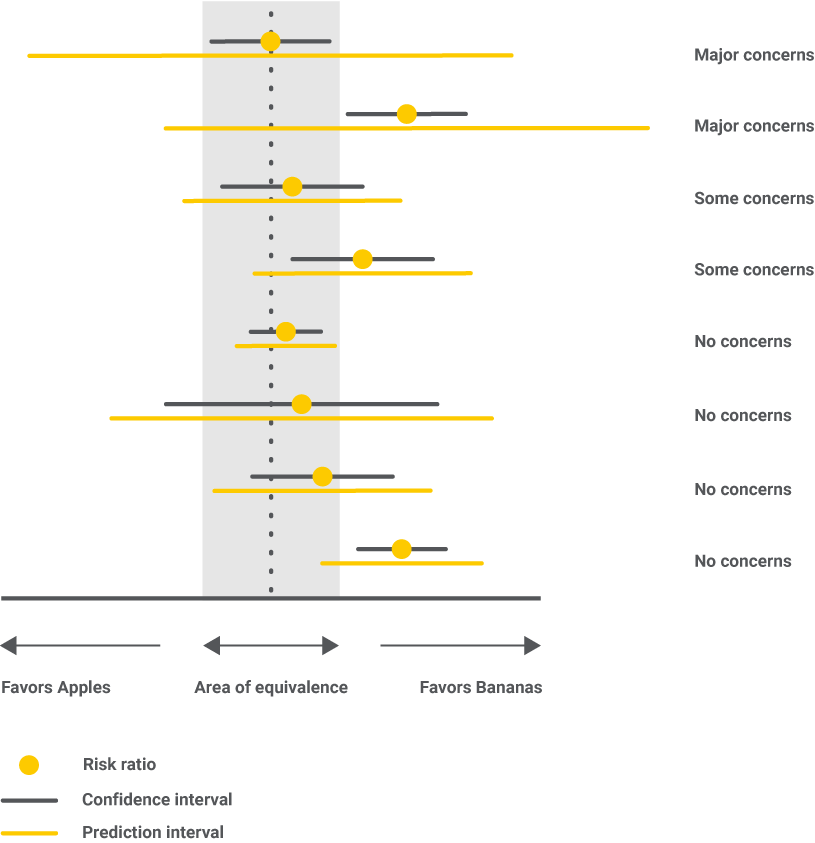
In the end, both high imprecision and high heterogeneity say that we don’t have enough evidence and that more data is needed to draw a conclusion.
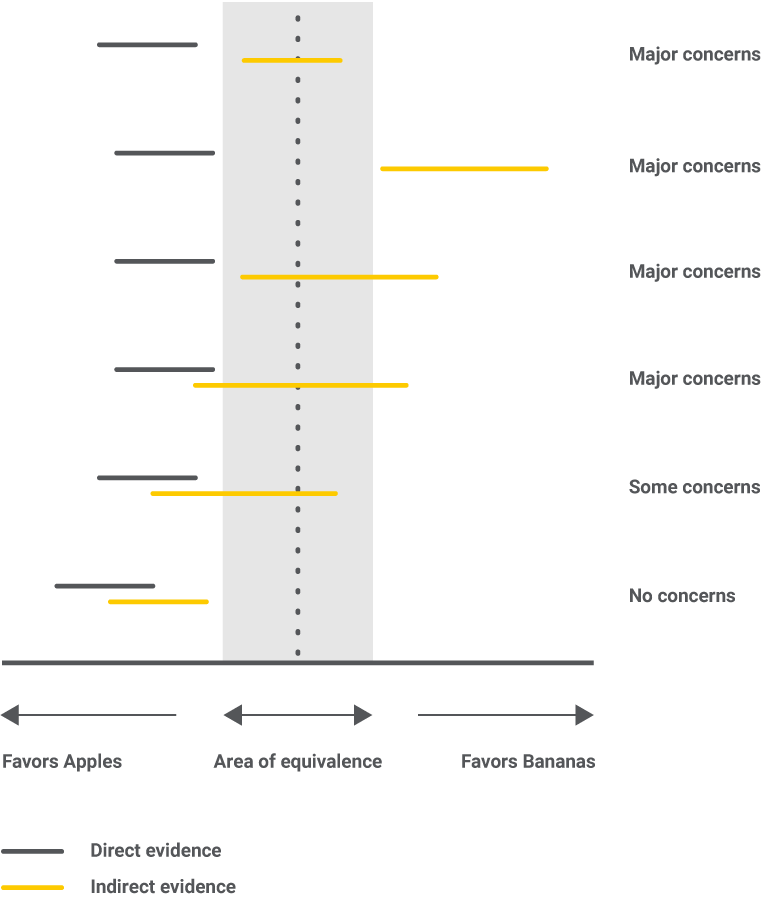
Incoherence is the statistical manifestation of intransitivity. If studies were not similar enough, we would have a higher level of concern. Potential causes for incoherence can be errors in data collection, too broad eligibility criteria, or study characteristics with hidden impacts on the results. All possible situations are presented in the figure below.
Step 8 – Conclusion
An NMA is currently the best available evidence to support a decision since comparisons between all interventions rarely exist. So, if an elephant would want a longer trunk, he should stick to bananas since the numbers are in their favor and the quality of evidence is reasonable. For doctors, it will be a bit more complicated, but in the end, the decision should rely on a combination of good numbers and a solid quality of evidence.
What now?
We used elephants and fruits, but we can change these to patients and medicines, and then the possibilities to explore will become endless. A network meta-analysis is a powerful and resourceful tool for supporting an evidence-based decision. With the help of artificial intelligence, Medstone is working on automating the entire process to get answers in a matter of days instead of months or years.
If you have a medical or pharmaceutical question, we’d be happy to help you out! Contact us at info@medstone.nl, and we’ll help you find your AI-powered solution.
This blog post was previously published on medstone.com

