Does eating carrots help your eyesight? Do bilinguals have bigger brains than monolinguals? And what are the odds of catching the flu, even though you’re vaccinated? These kinds of questions keep scientists from all different fields of research busy, every day. One thing they all have in common, whether they’re psychologists, linguists or medical researchers? In order to draw conclusions from the research they’re doing, they use statistics.
You can use statistics to say something about a population by researching a sample of that population. But how exactly do statistical tests answer our research questions? Let’s take a look at an example question: do elephants get longer trunks by eating bananas?
Clinical trials
If we want to know whether a diet of bananas influences the length of an elephant’s trunk, we can set up a clinical trial. To do so, we assemble two groups of elephants, who will be our test subjects. We feed both groups a healthy diet, the only difference being that one group’s diet includes bananas, and the other does not. For the duration of the trial, the trunks will be closely monitored and measured. At the end of the trial, we’ll look at the trunk lengths to see how many elephants have a longer trunk than they did at the beginning of the trial.
Let’s say both groups consist of 100 elephants. 50 of the elephants who were fed bananas show trunk growth, whereas we see trunk growth for only 25 of the elephants who did not eat any bananas. The banana group has double the number of elephants with a longer trunk. But can we now conclude with certainty that eating bananas lengthens the trunk of an elephant?


By carefully setting up a trial, we try to make sure the only difference between the groups is that one is fed bananas while the other is not. Then, if we find a difference in trunk growth, we can attribute this difference to the bananas. We are left with the question: is there a difference between our two elephant groups, in terms of trunk growth?
Statistical hypothesis testing
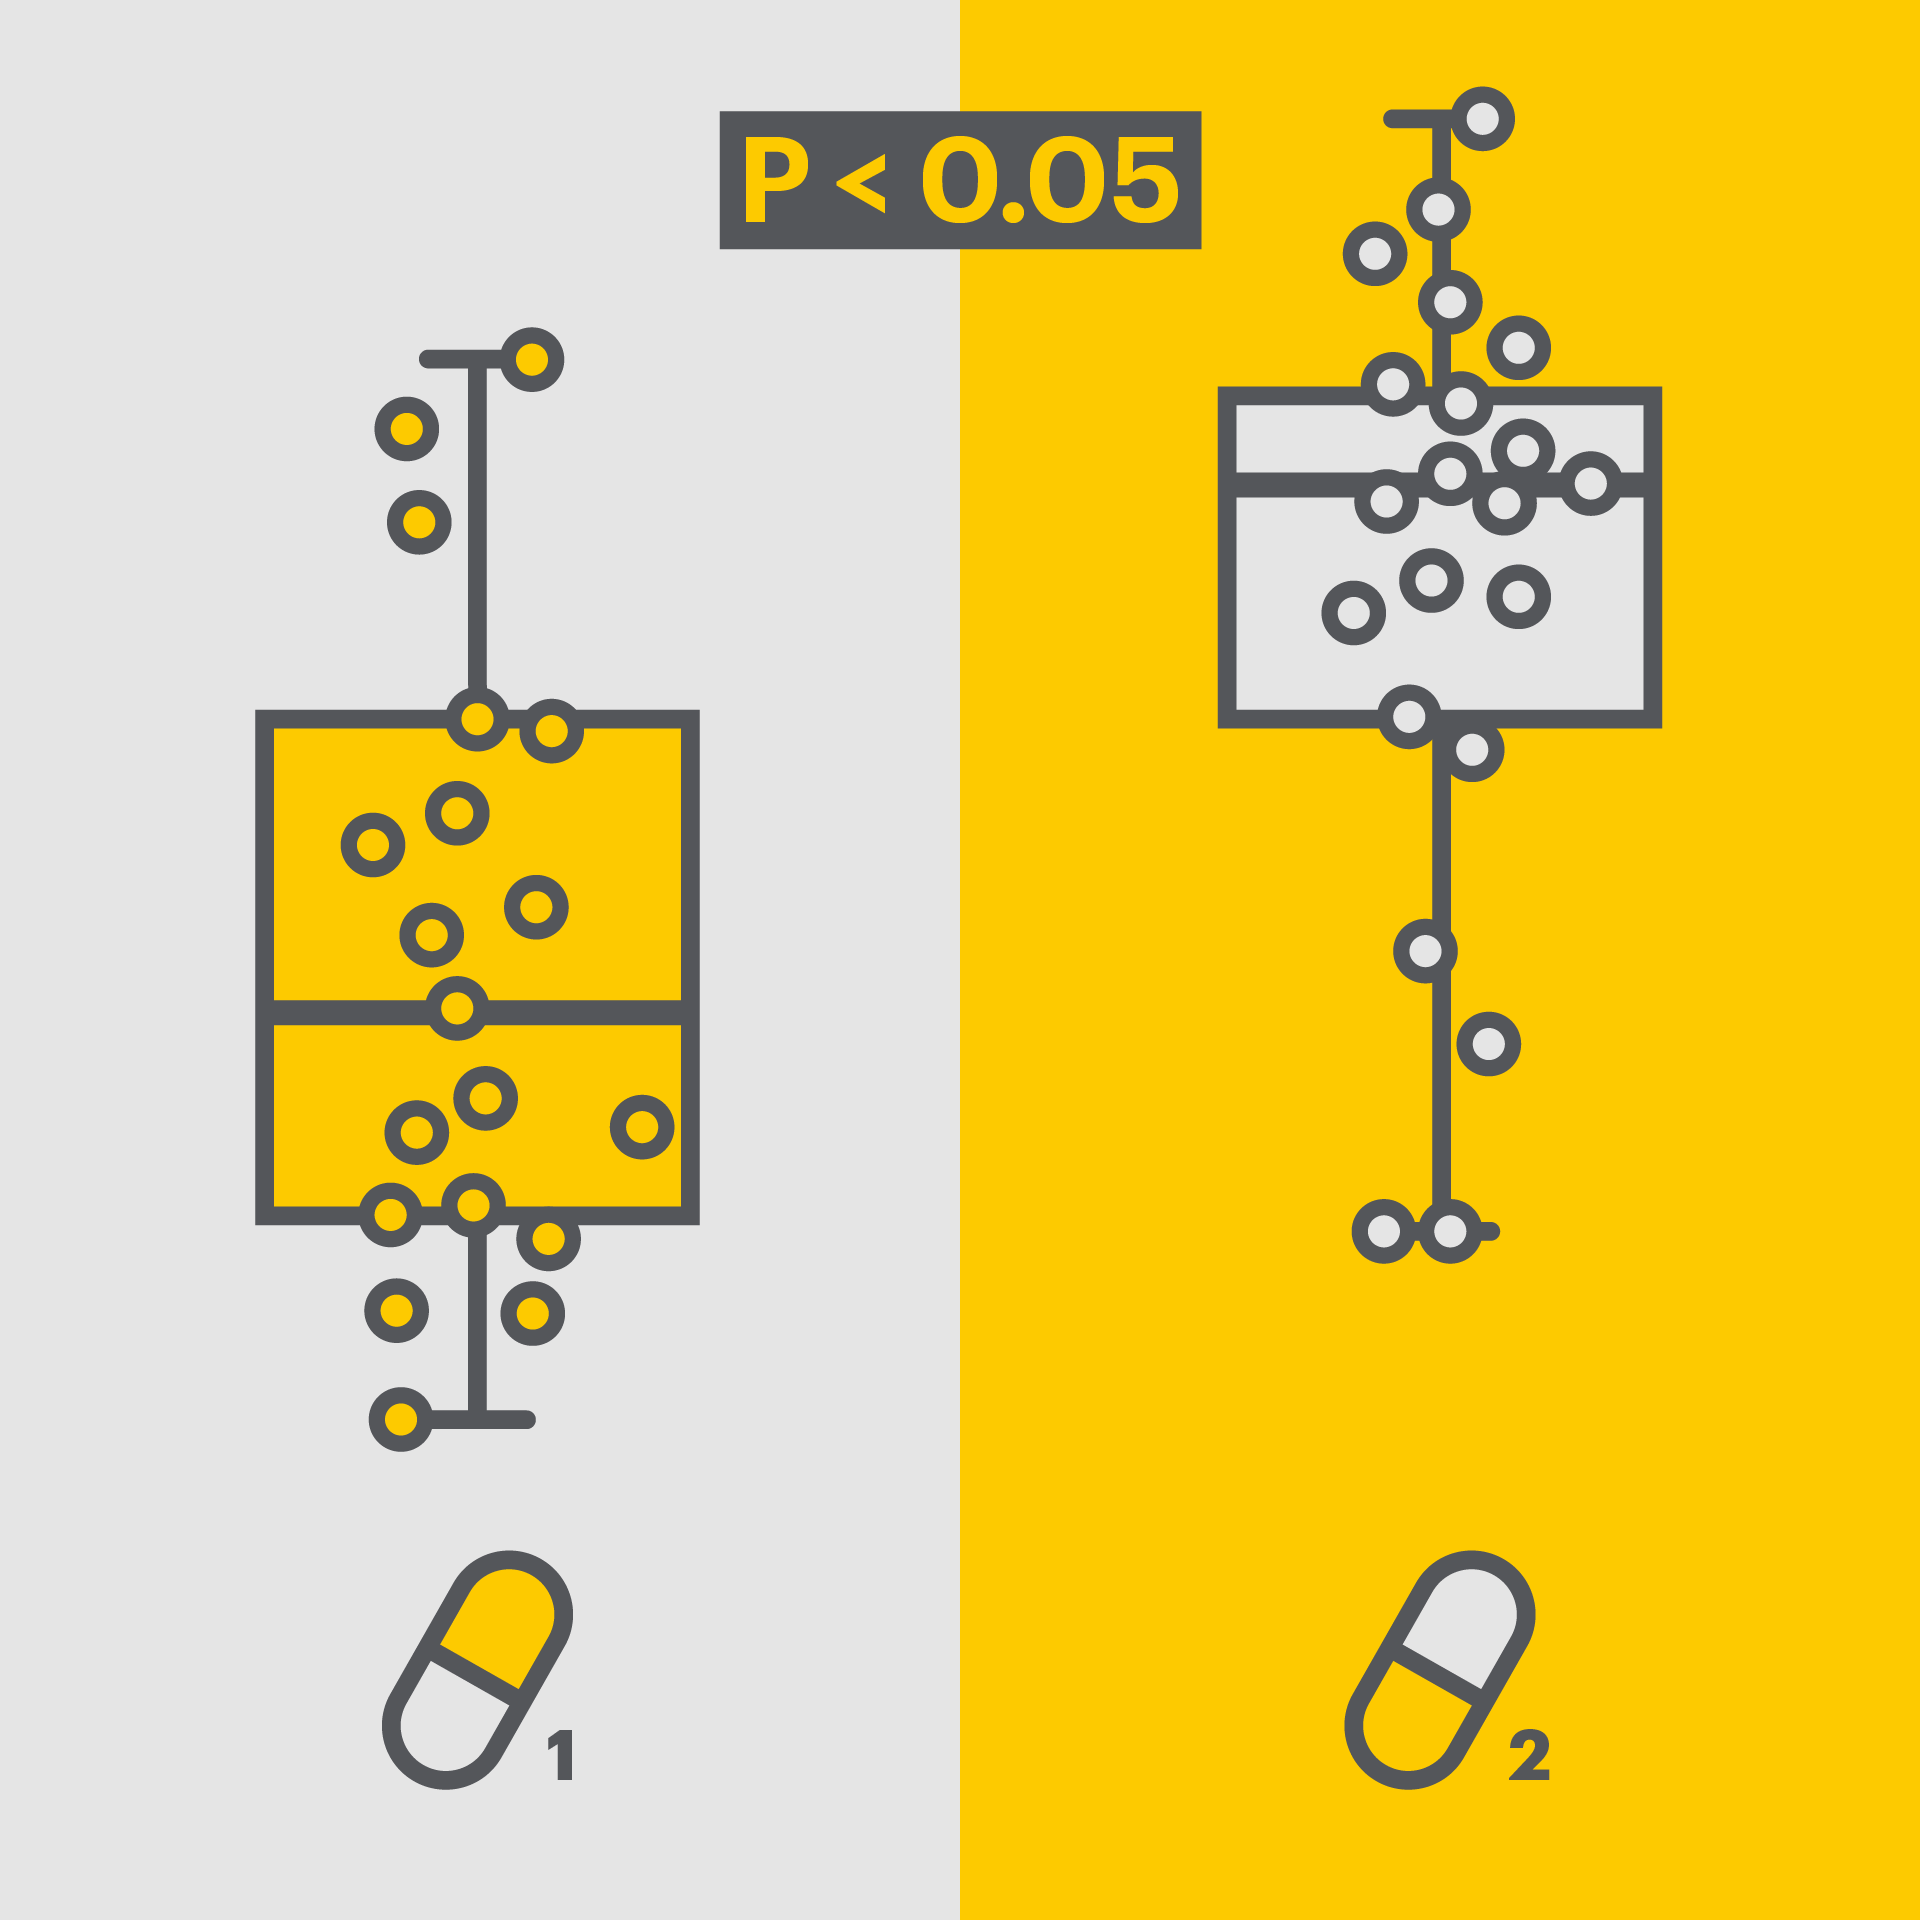
For these kinds of questions, where we want to show the difference between two groups, we need statistical hypothesis testing. With the help of such a statistical test, we can determine whether the effect found in a clinical trial really exists, or is just due to chance. We need to formulate two hypotheses for statistical testing:
- a null hypothesis (H0) that states there is no difference between the two groups (which we want to rule out),
- and an alternative hypothesis (H1) that states there is a difference between the two groups (which we want to show).
For our elephant example, we can then think of the following hypotheses:
- H0: The length of an elephant’s trunk is not increased by eating bananas. There is no difference in trunk growth between the group of elephants that eats bananas and the group of elephants that does not eat bananas.
- H1: The length of an elephant’s trunk increases by eating bananas. There is a difference in trunk growth between the group of elephants that eats bananas and the group of elephants that does not eat bananas.
A statistical test can show that the null hypothesis is (probably) false, after which we can reject this hypothesis. This is why we formulate whatever we want to find out in the alternative hypothesis. In other words, we’re not directly trying to prove something, but rather trying to disprove the opposite. If we cannot reject the null hypothesis, this doesn’t necessarily mean it’s correct, but rather that more information is needed to draw a conclusion. This is why formulating the right hypotheses is so important.
We can reject or accept our null hypothesis by applying a statistical hypothesis test to the results of our trial. To do so, we use a summary of the data, such as an average. In our case, we’ll be looking at the number of elephants whose trunk has increased in length during our trial. This summary is what we call a test statistic and plays an important role in statistical analysis. When choosing our test statistic, we take into account the type of data we’re dealing with, as well as our null hypothesis and which assumptions we can make about our data. One such assumption could be an equal spread of trunk length across our two groups of elephants. This means that in both groups, the shortest and longest trunks approximately equally deviate from the average trunk length. This way we know which value we can expect for our test statistic when our null hypothesis is true. If, in our trial, bananas turn out not to influence the length of an elephant’s trunk, we can expect an equal amount of elephants in both groups whose trunk has grown.
Accidentally drawing the wrong conclusion
Still, it’s possible to draw a wrong conclusion based on the data. There are two ways this could happen:
- Rejection of a true null hypothesis (Type I error, we say there is a difference where there actually isn’t)
- Failure to reject a false null hypothesis (Type II error, there is a difference but we don’t say there is)
You could also say Type I errors are false positives, and Type II errors are false negatives. We predominantly want to prevent Type I errors, because they falsely draw strong conclusions.
What are p-values?
The outcome of a statistical hypothesis test is what we call a p-value. We use p-values to prevent drawing those wrong conclusions, so we don’t end up accepting the wrong hypothesis. The p-value, or observed significance level, is a number between 0 and 1 and tells us the probability of a Type I error. You could also say a p-value is the probability of finding more extreme values for the same measurements, assuming our null hypothesis is true. When this probability is small enough, you can reject the null hypothesis. The outcome of the test is then deemed statistically significant. To determine what is ‘small enough’ we use a significance threshold. This is a somewhat arbitrary threshold that the scientific community has agreed upon, and is often set at 0.05. When a p-value is smaller than 0.05, we say our findings are statistically significant. This means the effect we see in the data is probably not caused by chance. If we were to repeat the trial, we expect to find the same effect.
But it’s still not impossible for the effect to be caused by chance. If we repeat our experiment, we probably won’t find exactly the same results. The difference we’ve found in our first trial could be completely coincidental, and not explicitly caused by the eating of bananas. If that is the case, and we have wrongly rejected our null hypothesis, that means we have made a Type I error. If we use the threshold of 0.05, we can expect to make a Type I error in 1 out of 20 cases of significant results, as long as we are dealing with plenty of trials. This may sound like a lot, and you might be tempted to say we should lower the significance threshold. However, lowering the threshold is not always desirable, as that would increase the amount of Type II errors.
Wiggle room
P-values aren’t everything. While a p-value can tell us whether there’s a difference between our two elephant diets, it doesn’t tell us how big that difference is. It could very well be that the difference is so small that both diets have approximately the same effect on trunk length. To gain some more insight into the amount of difference between our two groups, we can take a look at what’s called the confidence interval. Similar to the p-value, the confidence level shows whether the difference between our two groups is statistically significant.
A 95% confidence interval gives us a margin that contains the true effect with a 95% chance. This means that if we were to repeat our trial 100 times, the true effect is found within the confidence interval 95 times. This corresponds to the significance threshold we saw earlier for a p-value of 0.05. At a 50% confidence interval, we expect to find the true effect in 50 out of 100 trials, as depicted in the figure below.
Our findings are not significant if the interval also contains the possibility that both diets work equally as good.

Figure 1. Confidence intervals for four trials, p-values are shown on the right side. The 75% confidence intervals are larger than the 50% confidence intervals because we make a larger estimate for greater certainty. The green intervals indicate a significant finding, and the yellow intervals indicate a not significant finding.
In our elephant trial, we saw trunk growth in 25 of the 100 elephants who were fed no bananas, and in 50 of the 100 elephants who did eat a banana-filled diet. Based on these numbers, we expect that eating bananas is approximately twice as effective for trunk growth as not eating bananas. Let’s say we’re repeating the trial again, and this time we see that 60 out of 100 elephants who were fed bananas show trunk growth. Out of the 100 elephants who did not eat bananas during the trial, 20 have gotten a longer trunk. In this case, we estimate the banana diet to be three times as effective for trunk growth as a diet without bananas. If both groups were to show an equal amount of elephants with trunk growth, the effect of both diets is the same and we can say the one diet is one time as effective as the other diet. If the confidence interval contains the value 1, there is no significant difference between the two groups.
The confidence interval we find for our trunk data is a banana-fuelled increase in trunk growth between 1.4 and 3 times. As 1.4 is greater than 1, the effect is statistically significant. If we run a statistical test on this data, like Fisher’s exact test, we find a p-value of 0.0005. This also indicates a statistically significant effect. Based on our data, we can say with great confidence that bananas increase the length of our elephants’ trunks.
Trunk lengtheners and blood pressure reducers
Using these statistical methods, we can say something about the influence of bananas on trunk length by looking at a sample of 200 elephants. Research about, for example, medicines doesn’t differ all that much from our elephant example. When researching the effectiveness of a blood pressure reducer like metoprolol, scientists will set up a clinical trial similar to our trial with elephants. A sample of the population will be divided into two groups: one group will receive metoprolol, the other group will get a placebo. By monitoring the blood pressure of both groups, and performing statistical hypothesis tests on the outcoming data, researchers can draw conclusions on the effect of metoprolol on blood pressure.
More data
The quality of predictions often increases as more data is gathered. If multiple studies have been conducted on the same phenomenon, you could take those studies and compare them to each other using statistical methods. At Medstone, we do exactly that, but with the help of artificial intelligence. With our machine learning algorithm, we can automatically select and read multiple studies in a matter of seconds. With the time we save, we can focus on comparing the data for our (meta) network analyses. Curious about meta-analyses? You can read more about it in our blog post about literature reviews. Click here to find out more about how we use AI to automatically scan and select scientific studies.
If you have a medical or pharmaceutical question, we’d be happy to help you out! Contact us at info@medstone.nl and we’ll help you find your AI-powered solution.
This blog post was previously published on medstone.com


